The reporter package allows users to insert RTF code
with report_options(allow_code = TRUE) in RTF file. This
gives users more flexibility to design their RTF output formats.
Insert RTF Code
The reporter package can let users insert RTF code in data sets, titles, footnotes, headers, and footers.
Let’s prepare a data set with RTF code:
df <- read.table(header = TRUE, text = '
      var     label        A             B
      "ampg"   "\\li360 N"          "19"          "13"
      "ampg"   "\\li360 Mean"       "18.8"  "22.0 (4.9)"
      "ampg"   "\\li360 Median"     "16.4{\\sub mm}"        "21.4{\\super 2}"
      "ampg"   "\\li360 {\\cf12 Q1 - Q3}"    "15.1 - 21.2" "19.2 - 22.8"
      "ampg"   "\\li360 Range"      "{\\cf2 10.4 - 33.9}" "14.7 - 32.4"
      "cyl"    "\\li360 8\\line Cylinder" "\\ul 10 ( 52.6%) \\ul0" "4 ( 30.8%)"
      "cyl"    "\\li360 6\\line {\\cf11 Cylinder and more perhaps more}" "4 ( 21.1%)"  "3 ( 23.1%)"
      "cyl"    "\\li360 4\\line Cylinder" "\\ul 5 ( 26.3%) \\ul0"  "6 ( 46.2%)"')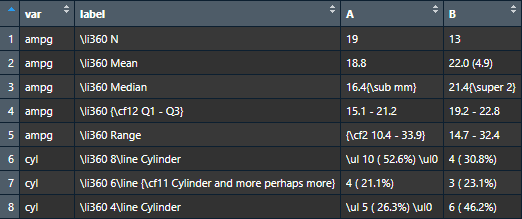
There are some RTF formatting codes in the data set:
- Indentation with
\\li - Subscript and Superscript with
\\suband\\super - Coloring with
\\cf - Underline with
\\ul
To use RTF code, please use
report_options(allow_code = TRUE) to the report object.
While designing the RTF code, please note that curly braces should be
doubled such like {{\\cf6 Group A}}. Special characters
with the common package
can still work with single curly braces such like
{common::supsc('2')}.
fp <- file.path(tempdir(), "example17.rtf")

# Create table
tbl <- create_table(df, first_row_blank = TRUE, borders = c("all")) |>
  stub(c("var", "label"), width = .8) |>
  define(var, blank_after = TRUE, label_row = TRUE,
         format = c(ampg = "\\i Here is a italic label \\i0.",
                    cyl = "\\ul Under line label \\ul0")) |>
  define(A, label = "\\shad {{\\cf6 Group A}} {common::supsc('2')}\\shad0", align = "center", n = 19) |>
  define(B, label = "\\outl Group B \\outl0", align = "center", n = 13) |>
  footnotes("\\i\\fs14 * Italic Small Table Footnote \\fs18")

# Create report and add content
rpt <- create_report(fp, orientation = "portrait", output_type = "RTF",
                     font = "Times") |>
  report_options(allow_code = TRUE) |>
  page_header(left = "\\strike Strikethrough header \\strike0", right = "Study: Cars") |>
  titles("\\b\\i {{\\highlight7 This is yellow italic highlight}} \\b0\\i0",
         "\\fs0\\fs28 {{\\cf2 This is a blue big title}} \\fs18") |>
  add_content(tbl) |>
  footnotes("\\i\\fs14 * Italic Small Report Footnote \\fs18") |>
  page_footer(left = "Left",
              center = "Confidential",
              right = "Page [pg] of [tpg]")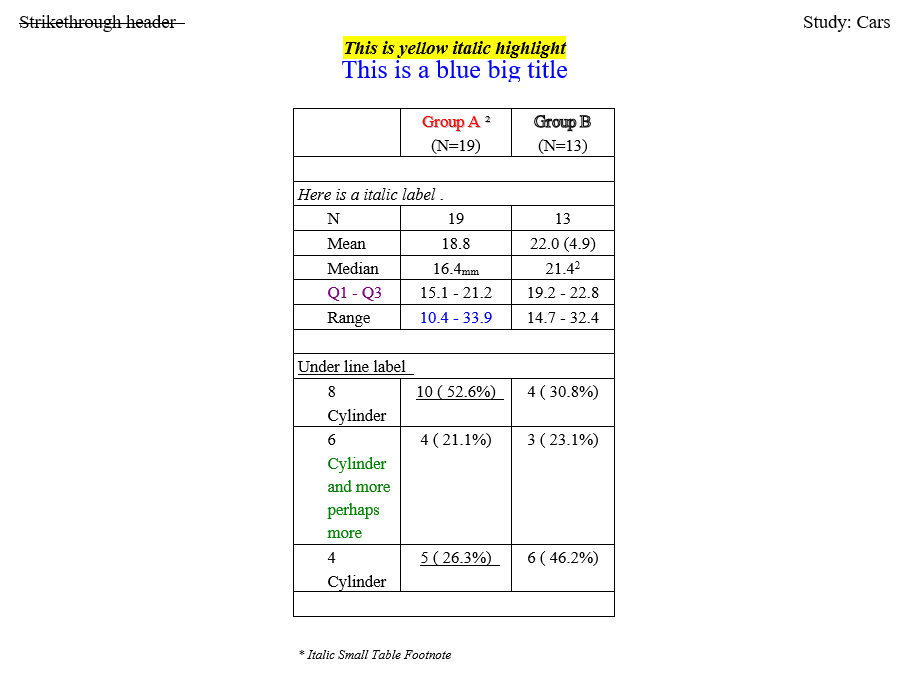
All the RTF codes work as expected:
- Header is formatted with strike through.
- Titles are formatted with yellow highlight, italic, bold, blue color, and bigger font size.
- Column labels are formatted with red, shadow, and outline.
- Row labels are formatted with italic and underline.
- Subscript and superscript are displayed.
- Data values are formatted with blue, purple, underline, and indentation.
- Footnotes are formatted with italic and smaller font size.
The color is followed by SAS color table:
-
\cf1: Black -
\cf2: Blue -
\cf3: Cyan -
\cf4: Lime Green -
\cf5: Magenta -
\cf6: Red -
\cf7: Yellow -
\cf8: White -
\cf9: Navy Blue -
\cf10: Teal -
\cf11: Green -
\cf12: Purple -
\cf13: Maroon/ Dark Red -
\cf14: Olive -
\cf15: Gray -
\cf16: Light Gray
With report_options(allow_code = TRUE), users can insert
RTF code to design their outputs flexibly. To learn more parameters in
report_options(), please go to the next example.