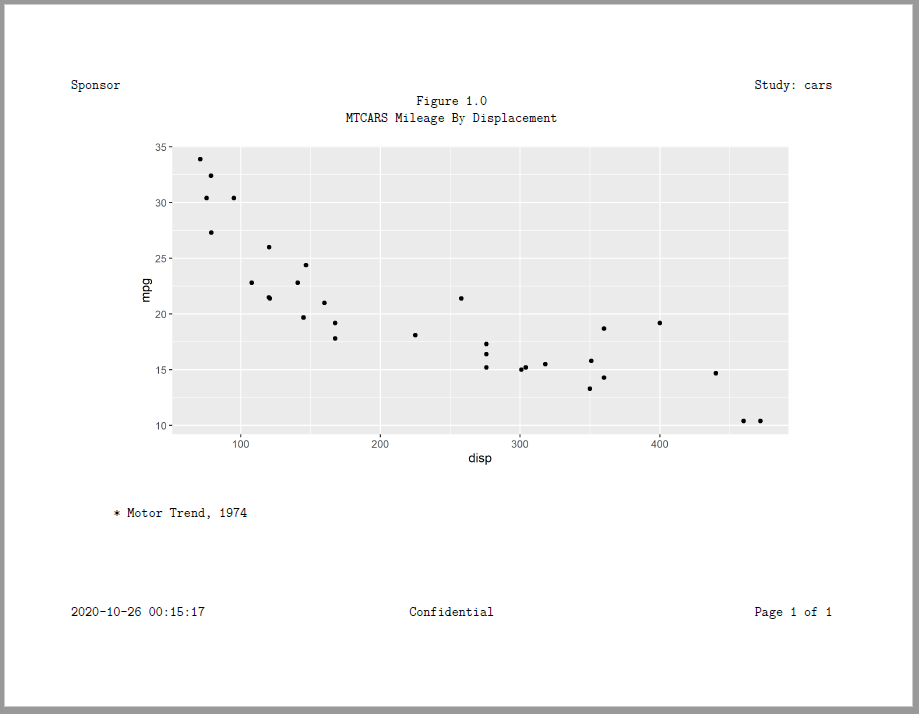
Create a Report with a Figure
RTF, PDF, HTML, and DOCX also support plots produced with the ggplot2
package. Use the create_plot() function to create plot
content for a report. The plot can be added to the report with the
add_content() function, just like tables and text.
If you want to add a custom image from another charting package, you
may also pass a path to a JPEG file on the create_plot()
function. The write_report() function will then get the
image and insert it into the report at the specified location.
library(reporter)
library(ggplot2)

# Create temporary path
tmp <- file.path(tempdir(), "example10.pdf")

# Prepare data
dat <- mtcars[order(mtcars$cyl), ]

# Generate plot
p <- ggplot(dat, aes(x=disp, y=mpg)) + geom_point()

# Define plot object
plt <- create_plot(p, height = 4, width = 8) %>%
  titles("Figure 1.0", "MTCARS Mileage By Displacement", blank_row = "none") %>%
  footnotes("* Motor Trend, 1974")

# Add plot to report
rpt <- create_report(tmp, output_type = "PDF") %>%
  set_margins(top = 1, bottom = 1) %>%
  options_fixed(font_size = 12) %>%
  page_header("Sponsor", "Study: cars") %>%
  add_content(plt) %>%
  page_footer(Sys.time(), "Confidential", "Page [pg] of [tpg]")

# Write out report
res <- write_report(rpt)


# View report
# file.show(tmp)