Specify Fonts and Borders
By default, the reporter package will create fixed-width style reports in Courier font. The package supports two additional fonts: Arial and Times New Roman. The package also supports the ability to turn on borders for your content. To demonstrate, the simple demographics table seen previously is reproduced below in Arial font with borders around the table, titles, and footnotes.
library(reporter)

# Create temporary path
tmp <- file.path(tempdir(), "example10.rtf")

# Read in prepared data
df <- read.table(header = TRUE, text = '
      var     label        A             B
      "ampg"   "N"          "19"          "13"
      "ampg"   "Mean"       "18.8 (6.5)"  "22.0 (4.9)"
      "ampg"   "Median"     "16.4"        "21.4"
      "ampg"   "Q1 - Q3"    "15.1 - 21.2" "19.2 - 22.8"
      "ampg"   "Range"      "10.4 - 33.9" "14.7 - 32.4"
      "cyl"    "8 Cylinder" "10 ( 52.6%)" "4 ( 30.8%)"
      "cyl"    "6 Cylinder" "4 ( 21.1%)"  "3 ( 23.1%)"
      "cyl"    "4 Cylinder" "5 ( 26.3%)"  "6 ( 46.2%)"')

# Create table
tbl <- create_table(df, first_row_blank = TRUE, borders = "all") %>%
  stub(c("var", "label")) %>%
  column_defaults(width = 1.25) %>%
  define(var, blank_after = TRUE, label_row = TRUE,
         format = c(ampg = "Miles Per Gallon", cyl = "Cylinders")) %>%
  define(label, indent = .25) %>%
  define(A, label = "Group A", align = "center", n = 19) %>%
  define(B, label = "Group B", align = "center", n = 13)  %>%
  titles("Table 1.0", "MTCARS Summary Table", borders = "outside",
         bold = TRUE, font_size = 14) %>%
  footnotes("* Motor Trend, 1974", borders = "outside")

# Create report and add content
rpt <- create_report(tmp, output_type = "RTF", font = "Arial",
                     font_size = 12) %>%
  set_margins(top = 1, bottom = 1) %>%
  add_content(tbl)

# Write out report
write_report(rpt)

# View report
# file.show(tmp)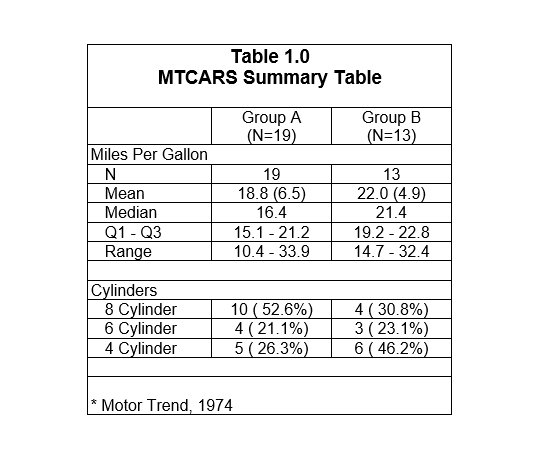
Next: Example 11: Figure