The reporter package creates regulatory-style statistical reports. It was designed to produce Tables, Listings, and Figures (TLFs) for the the pharmaceutical, biotechnology, and medical-device industries. However, the functions are generalized enough to provide statistical reporting for any industry. The package is written in Base R, and has no dependencies on any other reporting package.
The package is intended to give R programmers flexible report layout capabilities and a choice of output formats. The package will initially focus on printable, file-based output formats. The current version supports TXT, RTF, PDF, HTML, and DOCX output types. Note that, unlike other packages, all outputs from the reporter package are paged by default.
Key Features
The reporter package contains the following key features:
- Titles, footnotes, page header, and page footer are repeated on each page
- Supports header labels and spanning headers
- Calculates default columns widths automatically
- Includes automatic wrapping and splitting of wide and long tables
- Integrates with the fmtr package to format numeric, date, and character data
- Plots from the popular ggplot2 package can be added to RTF, PDF, HTML, and DOCX reports
- Allows appending multiple tables to a report, multiple tables to a page, and intermingling of text, tables, and plots
- Supports in-report date/time stamps and “Page X of Y” page numbering
How to use reporter
There are four steps to creating a report:
- Create report content
- Create report
- Add content to the report
- Write out the report
You can create the report with the create_report()
function. Content is created with the create_table(),
create_text(), or create_plot() functions. Add
content to the report with the add_content() function.
Finally, the report can be written to a file with the
write_report() function.
Let’s look at a simple example:
library(reporter)
library(magrittr)

# Create temp file name
tmp <- file.path(tempdir(), "example.pdf")

# Create report content
tbl <- create_table(mtcars) %>%
  titles("MTCARS Sample Data") %>%
  footnotes("* Motor Trend, 1974")

# Create report and add content
rpt <- create_report(tmp, output_type = "PDF",
                     font = "Courier", font_size = 12) %>%
  add_content(tbl)

# Write out the report
write_report(rpt)

# Un-comment to view report
# file.show(tmp)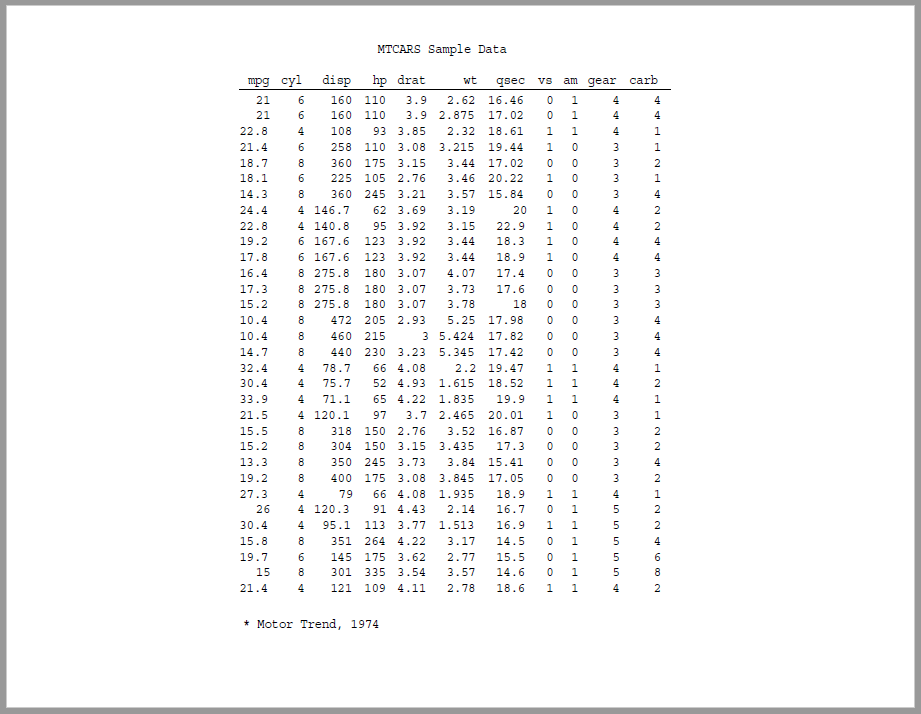
As you can see, using the reporter package, you can create a useful report with just a few lines of code. By default, the package creates a text report. But you can create reports in RTF, PDF, HTML, and DOCX with just a single parameter change.
Besides the functions shown above, there are additional functions to create page headers and footers, spanning headers, a report stub, a by-variable, and more. The package also allows you to add text and plots to a report. All of these capabilities are demonstrated in the examples below.
Next Steps
For next steps, it is recommended that you review some examples of the reporter package in action. The examples show a variety of common use cases. You will see that the reporter functions are very intuitive and easy to use. Here is a list of examples:
- Example 1: Listing
- Example 2: Table
- Example 3: Table Stub
- Example 4: Table and Text
- Example 5: Spanning Headers
- Example 6: Page Wrap
- Example 7: Page By
- Example 8: Title Header
- Example 9: RTF, PDF, HTML, and DOCX
- Example 10: Fonts and Borders
- Example 11: Figure
- Example 12: Styles
- Example 13: Superscripts and Subscripts
- Example 14: Page Break
- Example 15: Header and Footer Images
- Example 16: Grouping
- Example 17: Code Insertion
- Example 18: Report Options
- More Examples